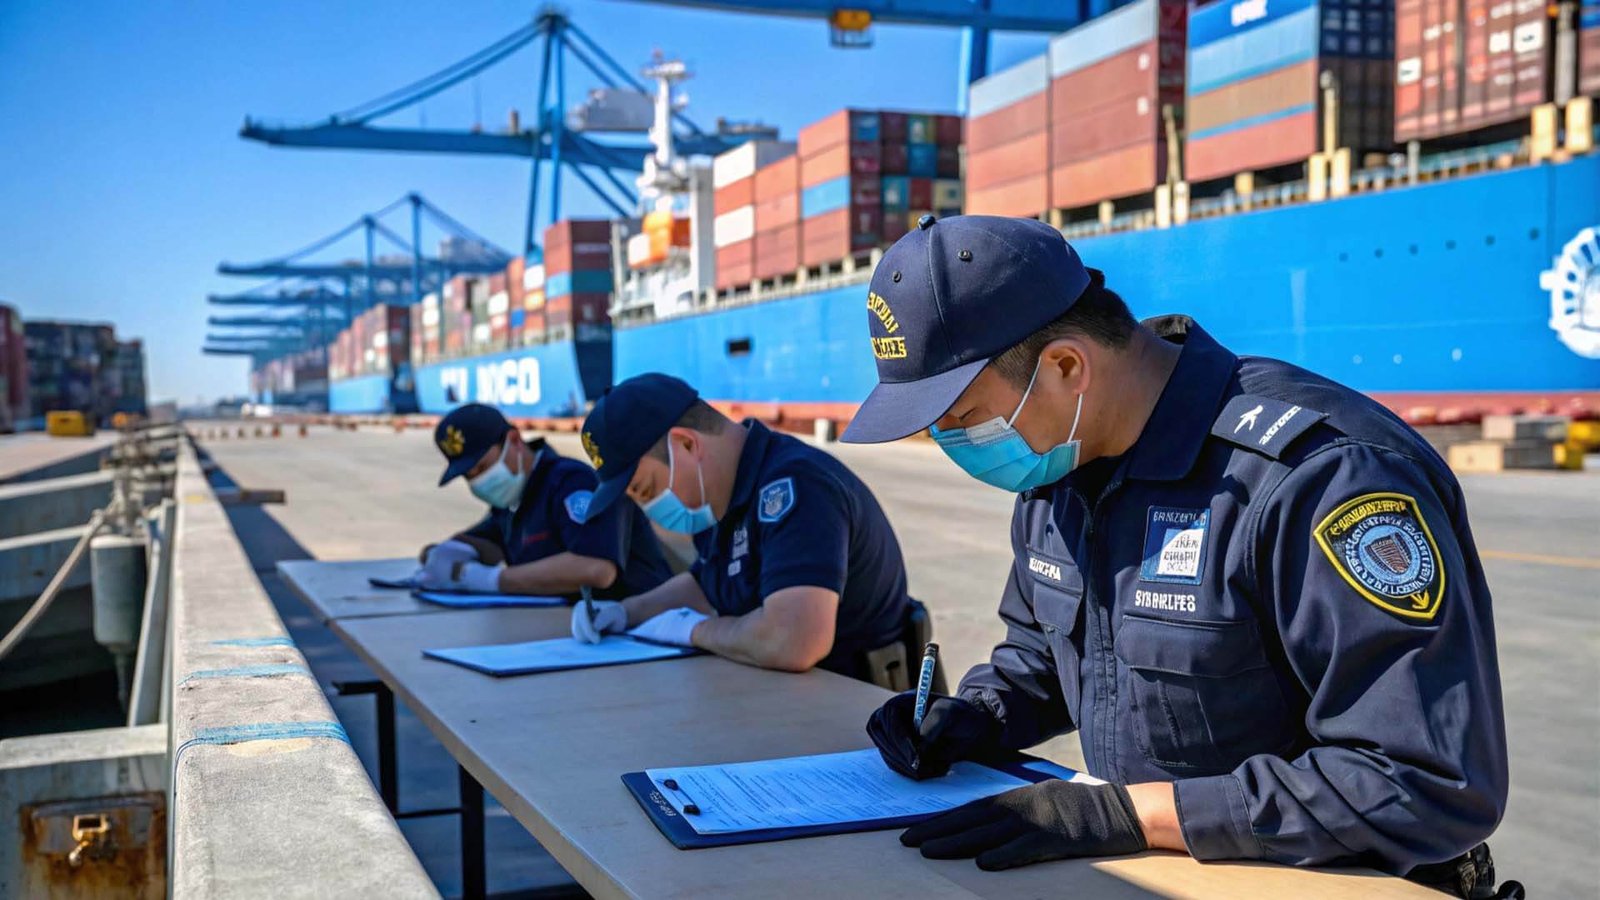
Struggling to report your shipping emissions? Inaccurate numbers can damage your reputation with customers. A good calculator gives you the clarity you need to stay compliant and competitive.
A shipping emissions calculator1 estimates greenhouse gas emissions2 generated by transporting goods, usually expressed as CO₂e. For U.S. importers, these calculations support ESG reporting3, customer disclosure requests, and internal decision-making by translating freight activity4 into measurable environmental impact across different transport modes5 and routes.
As an importer, I've seen how important these numbers are becoming. My clients, like Mark, are detail-oriented and need reliable data not just for cost savings6, but for reporting to their own stakeholders. It’s no longer a "nice-to-have" but a core part of business. But what do these calculators actually measure, and why should it be a priority for your business? Let's break it down so you can use this data to your advantage.
What does a shipping emissions calculator1 measure, and why does it matter for U.S. importers?
Customers are asking for your carbon footprint data7. You can't just guess. Knowing exactly what a calculator measures is the key to providing accurate, trustworthy reports for your partners.
A shipping emissions calculator1 estimates greenhouse gas emissions2 generated by transporting goods, usually expressed as CO₂e. For U.S. importers, these calculations support ESG reporting3, customer disclosure requests, and internal decision-making by translating freight activity4 into measurable environmental impact across different transport modes5 and routes.
When we talk about emissions, we're looking beyond just carbon dioxide. The goal is to get a complete picture of your shipment's environmental impact. This is where a good calculator becomes essential. It takes your logistics activities8 and turns them into a number you can actually use.
What Gets Measured?
The main output is "carbon dioxide equivalent9," or CO₂e. This is a standard unit that accounts for different greenhouse gases in a single number. While CO₂ is the most common gas from burning fuel, other gases like methane (CH₄) and nitrous oxide (N₂O) are also produced. These gases have a much higher warming potential than CO₂, so the CO₂e metric converts them into an equivalent amount of carbon dioxide. This gives you a more complete and standardized measure of your shipment's total climate impact. It's the universal language for emissions reporting.
Why It's Crucial for Importers
For U.S. importers, this isn't just an academic exercise. I've helped many clients use this data for very practical reasons. Your customers, investors, and even employees are increasingly demanding transparency. Being able to provide clear, data-backed emissions reports builds trust and can be a competitive advantage. It also helps with internal goals, allowing you to set benchmarks and track your progress toward a more sustainable supply chain10.
| Reason to Measure Emissions | Benefit for Your Business |
|---|---|
| ESG Reporting | Meet mandatory and voluntary reporting standards. |
| Customer Demands | Satisfy requests from large retail partners. |
| Brand Reputation | Show your commitment to sustainability. |
| Informed Decisions | Choose more efficient routes or modes of transport. |
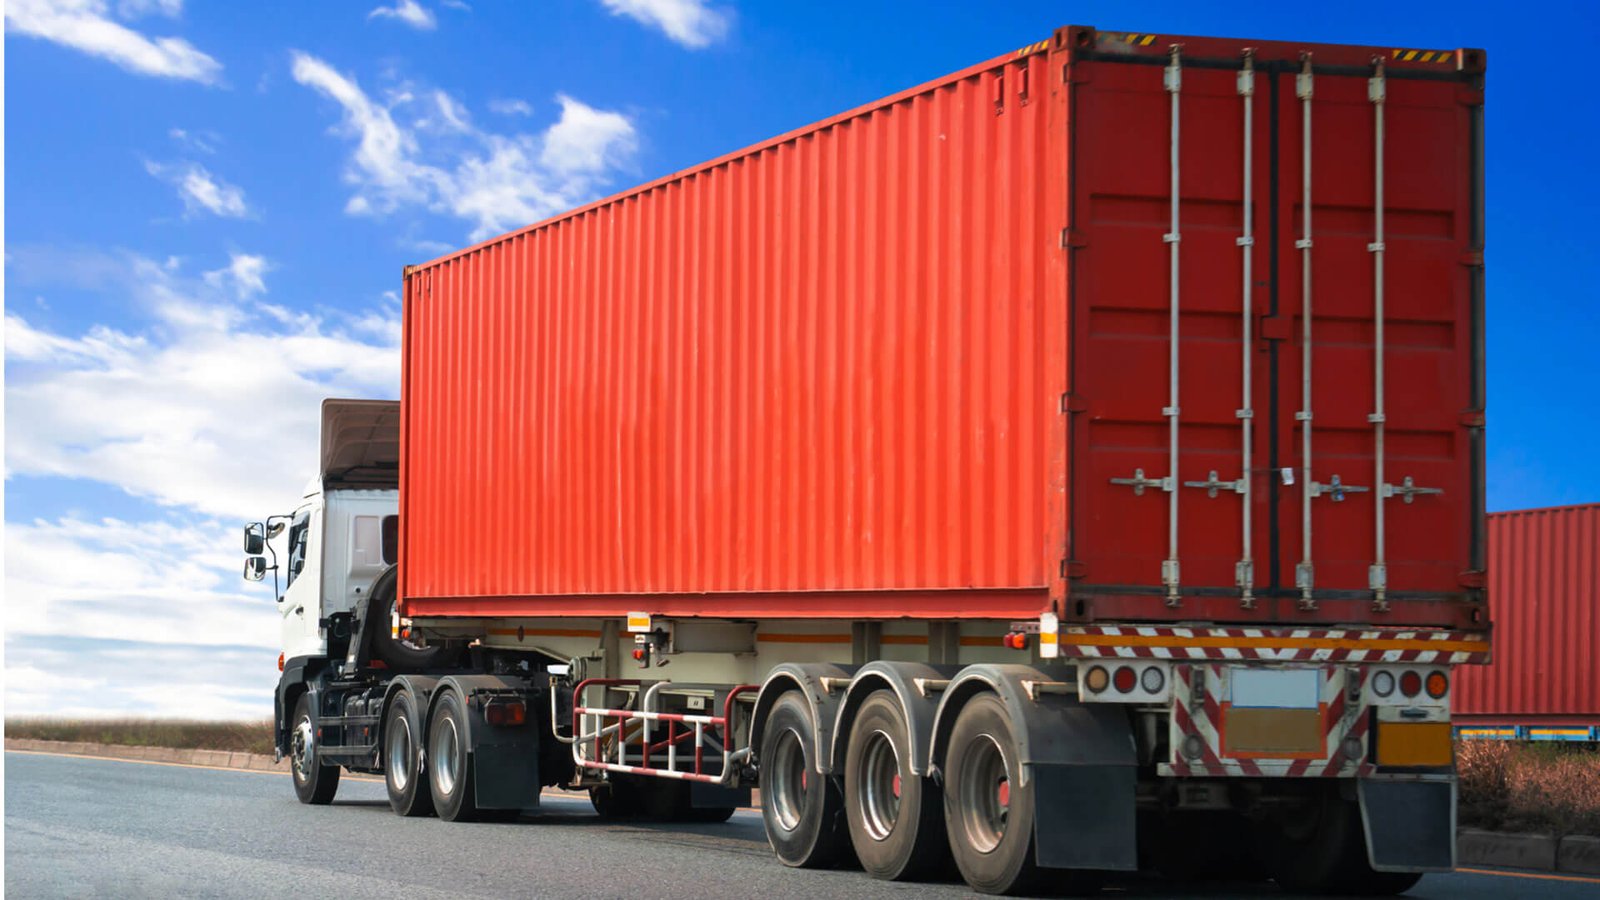
How are shipping carbon emissions calculated across different transport modes5?
You might assume all shipping modes are similar in emissions. This mistake can inflate your carbon footprint. Understanding the differences helps you make smarter, greener logistics choices for your business.
Shipping emissions are calculated using activity data such as distance, weight, and transport mode combined with standardized emission factors. Air freight typically produces the highest emissions per unit, while ocean and rail are lower. Calculators apply different methodologies per mode to reflect fuel use and efficiency differences.

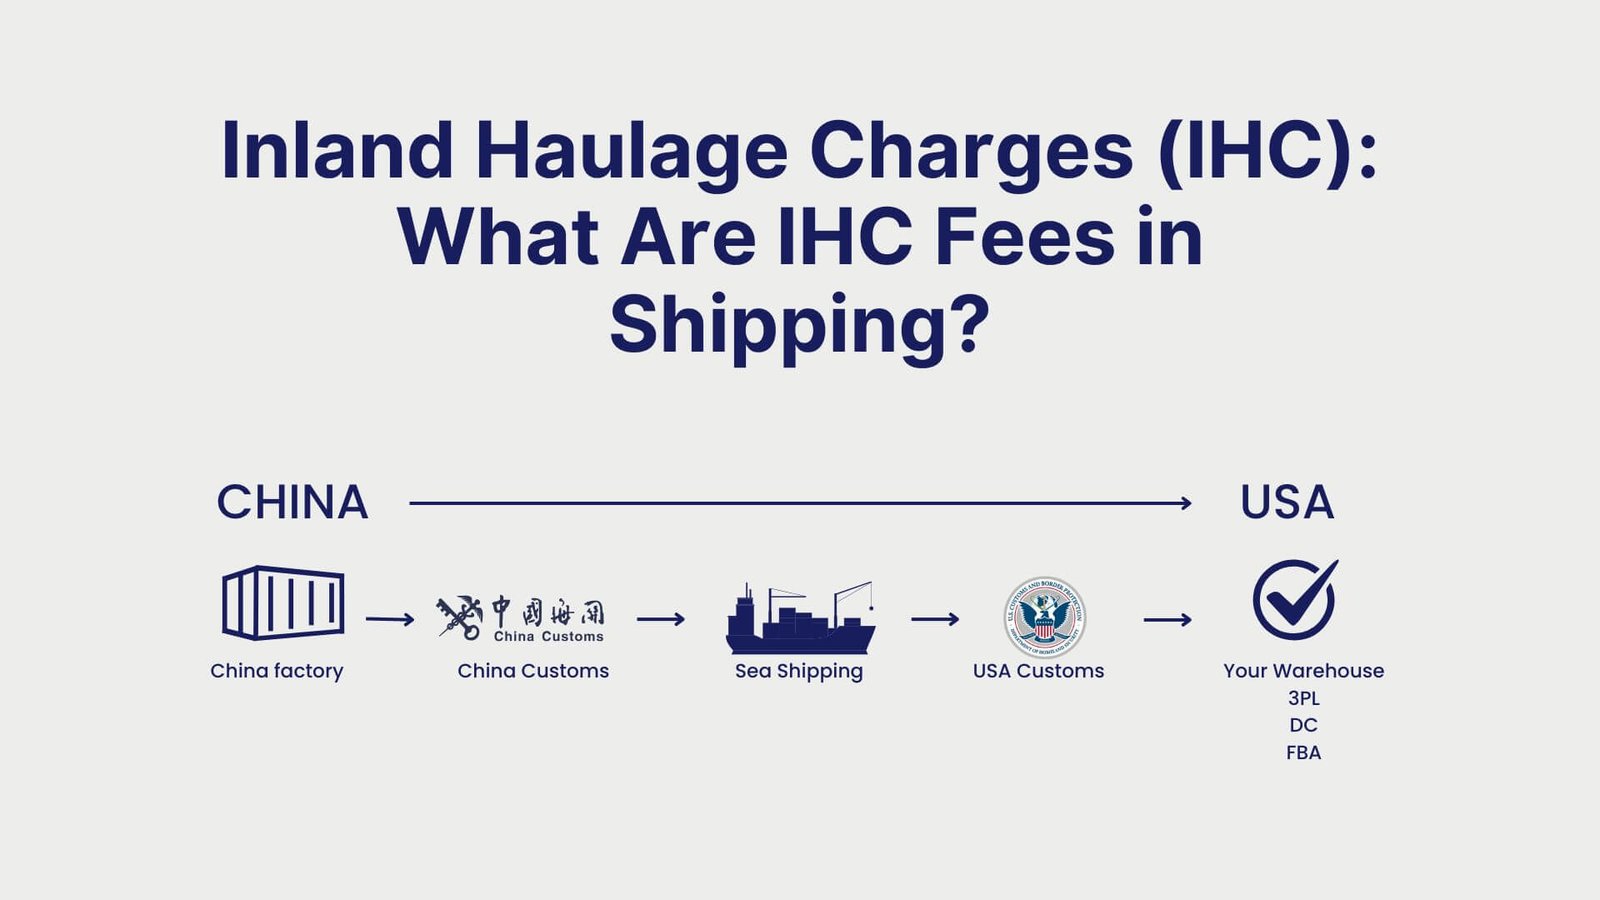
The core idea behind calculating emissions is straightforward, but the details matter a lot, especially when comparing different ways to move your goods from China to the USA. Each mode uses different fuel, travels at different speeds, and has a different capacity.
The Basic Calculation Formula
At its heart, the calculation follows a simple flow. You start with your shipment data, apply a calculation method, get emissions specific to the transport mode, and end up with a final CO₂e output. You can then use this output for reporting and making decisions. The formula generally looks like this:
Activity Data (e.g., distance x weight) × Emission Factor = Total Emissions
"Activity Data" is what you did—how heavy your cargo was and how far it traveled. The "Emission Factor" is a standard value that represents the kilograms of CO₂e produced per unit of activity (like per ton-kilometer).
Mode-Specific Differences
The emission factors vary wildly between transport modes5. This is why mode selection is one of the most impactful decisions an importer can make. A shipment that is not time-sensitive can have a drastically lower carbon footprint just by choosing a different mode.
| Transport Mode | Typical Emission Factor (CO₂e per ton-km) | Key Characteristics |
|---|---|---|
| Ocean Freight | Low | High capacity, slow speed. Most efficient for bulk goods. |
| Air Freight | Very High | Low capacity, very high speed. Used for urgent, high-value goods. |
| Rail Freight | Low to Medium | Efficient for long-distance land transport. Lower than trucks. |
| Trucking | Medium to High | Flexible for last-mile delivery, but less efficient than rail. |
As you can see, sending a container by air can produce over 40 times more emissions than sending it by sea. This is a trade-off I discuss with my clients every day.
What data do you need to calculate accurate shipping emissions?
Your emissions reports are all over the place. This inconsistency makes you look unreliable to your partners and customers. The secret to accurate, defensible results is starting with quality shipment data.
Accurate emissions calculations require reliable shipment data, including origin and destination, transport mode, cargo weight or volume, routing, and fuel assumptions. Missing or estimated data can significantly skew results, which is why importers with structured logistics data obtain more consistent and defensible emissions figures.
The old saying "garbage in, garbage out" is especially true for emissions calculations. The quality of your output depends entirely on the quality of your input. A vague estimate will only give you a vague result. To get a number you can stand behind, you need details.
Essential Data for Calculation
I always tell my clients, like Mark, that the more details we have, the more accurate the emissions report will be. Working with a logistics partner who tracks this information systematically is a huge advantage. We move from guessing to knowing. For example, a client once used a simple port-to-port distance for their calculation. When we analyzed the actual vessel tracking data, we found the real route was 15% longer due to weather and traffic. This single detail changed their entire annual emissions report.
The Impact of Data Quality
Having precise data is what separates a rough estimate from a report you can confidently share with stakeholders. Inaccurate or incomplete data forces the calculator to make assumptions, which introduces errors.
| Data Point | Why It's Important |
|---|---|
| Cargo Weight/Volume | Heavier/larger shipments require more fuel. This is a primary input. |
| Origin & Destination | Defines the total distance, but specific routing is better. |
| Transport Mode(s) | The single biggest factor. Ocean, air, rail, and truck have vastly different emission factors. |
| Specific Route/Vessel | Different ships and routes have different fuel efficiencies. This data refines the estimate. |
Getting this right means you have a solid foundation for all your sustainability efforts11.
What are the limitations of emissions calculators12, and why do results differ?
You used two different calculators for the same shipment and got conflicting results. Now you're confused and don't know which number to trust. Understanding their limitations helps you interpret the data correctly.
Emissions calculators differ due to varying methodologies, emission factors, routing assumptions, and data quality13. Most tools provide estimates rather than exact values, which can lead to inconsistent results across platforms. Importers should understand these limitations when using emissions data for reporting, comparisons, or compliance-related disclosures.

It can be frustrating to see different numbers for the same shipment. The key is to remember that these tools provide estimates, not perfect measurements. No two calculators are exactly alike, and the differences in their underlying frameworks can lead to different results. The goal isn't to find one "true" number but to use a consistent method over time.
Key Reasons for Different Results
The variance between calculators usually comes down to a few key factors. Some tools use older data, while others are updated frequently. Some use simple distance calculations, while others model more complex, realistic routes. The most important thing is to understand the methodology of the tool you choose and stick with it for consistency.
| Source of Variation | How It Affects Results |
|---|---|
| Methodology | Different frameworks (e.g., GLEC, EN 16258) have different rules and boundaries. |
| Emission Factors | The source and age of the emission factors can vary, changing the final calculation. |
| Routing Assumptions | Calculators may assume the shortest path, not the actual route taken by the vessel or truck. |
| Data Granularity | Some tools allow for detailed inputs (like vessel name), while others use broad averages. |
How to Approach These Estimates
Instead of getting stuck on the exact number, focus on the trends. Is your emissions-per-shipment going down over time? How does the emissions total for an ocean shipment compare to an air shipment in the same tool? The value lies in comparison and tracking progress. I advise my clients to pick a reputable, GLEC-framework-aligned calculator and use it consistently. This makes your year-over-year reporting meaningful and defensible.
How can you use emissions calculators12 to improve your supply chain decisions14?
You see emissions data as just another box to check for a report. But you're missing out on major opportunities for cost savings6 and efficiency gains. This data is a powerful tool for optimizing your supply chain.
Importers use emissions calculators12 to support sustainability reporting, respond to customer ESG requirements, and evaluate freight alternatives. By linking emissions data with cost and transit time, companies can make more informed trade-offs, improve transparency, and align logistics decisions with broader environmental and compliance goals.
This is where emissions data becomes more than just a number on a page. It becomes a strategic tool. For my clients, the real power comes when we connect emissions data to cost and transit time. Suddenly, you can see the full picture of your logistics choices.
From Reporting to Action
Moving from passive reporting to active decision-making is the goal. You can use the data to identify hotspots in your supply chain—routes or modes that are disproportionately high in emissions. For example, if you see that 10% of your shipments (the ones sent by air) are causing 50% of your emissions, it prompts a conversation. Can we improve our inventory planning to reduce the need for last-minute air freight? Can we consolidate LCL shipments into an FCL container to improve efficiency? These are the practical questions that lead to real improvements.
Making Smart Trade-Offs
Every shipment involves a balance of cost, speed, and now, environmental impact. Having data on all three allows you to make conscious, strategic trade-offs that align with your business goals. As your logistics partner, we help you analyze these options.
| Decision Scenario | Cost | Transit Time | Emissions | Best For |
|---|---|---|---|---|
| Air Freight | High | Fastest | Highest | Urgent, high-value goods |
| Standard Ocean | Low | Slow | Low | Stock replenishment, non-urgent goods |
| Fast Ocean Service | Medium | Medium | Medium-Low | A balance of speed and sustainability |
By using an emissions calculator, you can quantify the environmental "cost" of choosing a faster option, allowing you to decide if the trade-off is worth it. This level of visibility empowers you to build a smarter, more resilient, and more sustainable supply chain10.
Conclusion
Measuring shipping emissions is no longer optional. Use calculators to gain visibility, meet reporting demands, and make smarter, more sustainable logistics decisions for your business's future.
Explore this resource to understand how a shipping emissions calculator can help you accurately measure your carbon footprint. ↩
Learn about greenhouse gas emissions to grasp their impact on climate change and the importance of accurate reporting. ↩
Discover the significance of ESG reporting for businesses and how it can enhance your brand's reputation. ↩
Learn about freight activity and its relationship to emissions to better manage your logistics. ↩
Understand the emissions impact of various transport modes to make informed logistics decisions. ↩
Find out how reducing emissions can lead to significant cost savings in your logistics. ↩
Find out how to track carbon footprint data effectively to meet customer demands and improve sustainability. ↩
Learn how logistics activities contribute to shipping emissions and how to optimize them for sustainability. ↩
Explore the concept of CO₂e to understand how it standardizes emissions reporting across different gases. ↩
Explore the components of a sustainable supply chain to enhance your business's environmental impact. ↩
Discover how to leverage emissions data to strengthen your sustainability efforts. ↩
Learn about the limitations of emissions calculators to interpret your data accurately. ↩
Understand the importance of data quality in emissions calculations to ensure accurate reporting. ↩
Learn how emissions data can guide your supply chain decisions for better sustainability. ↩