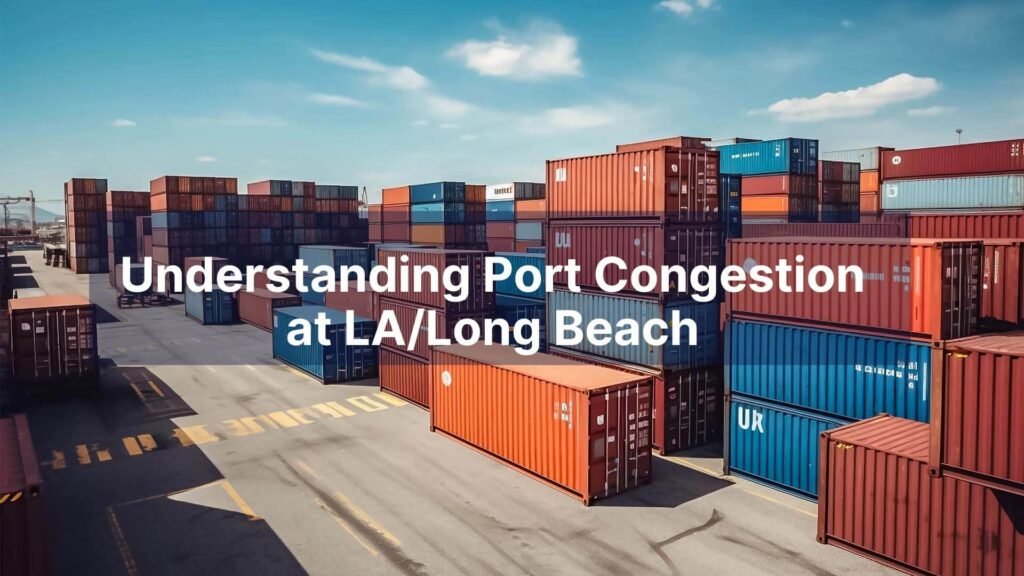
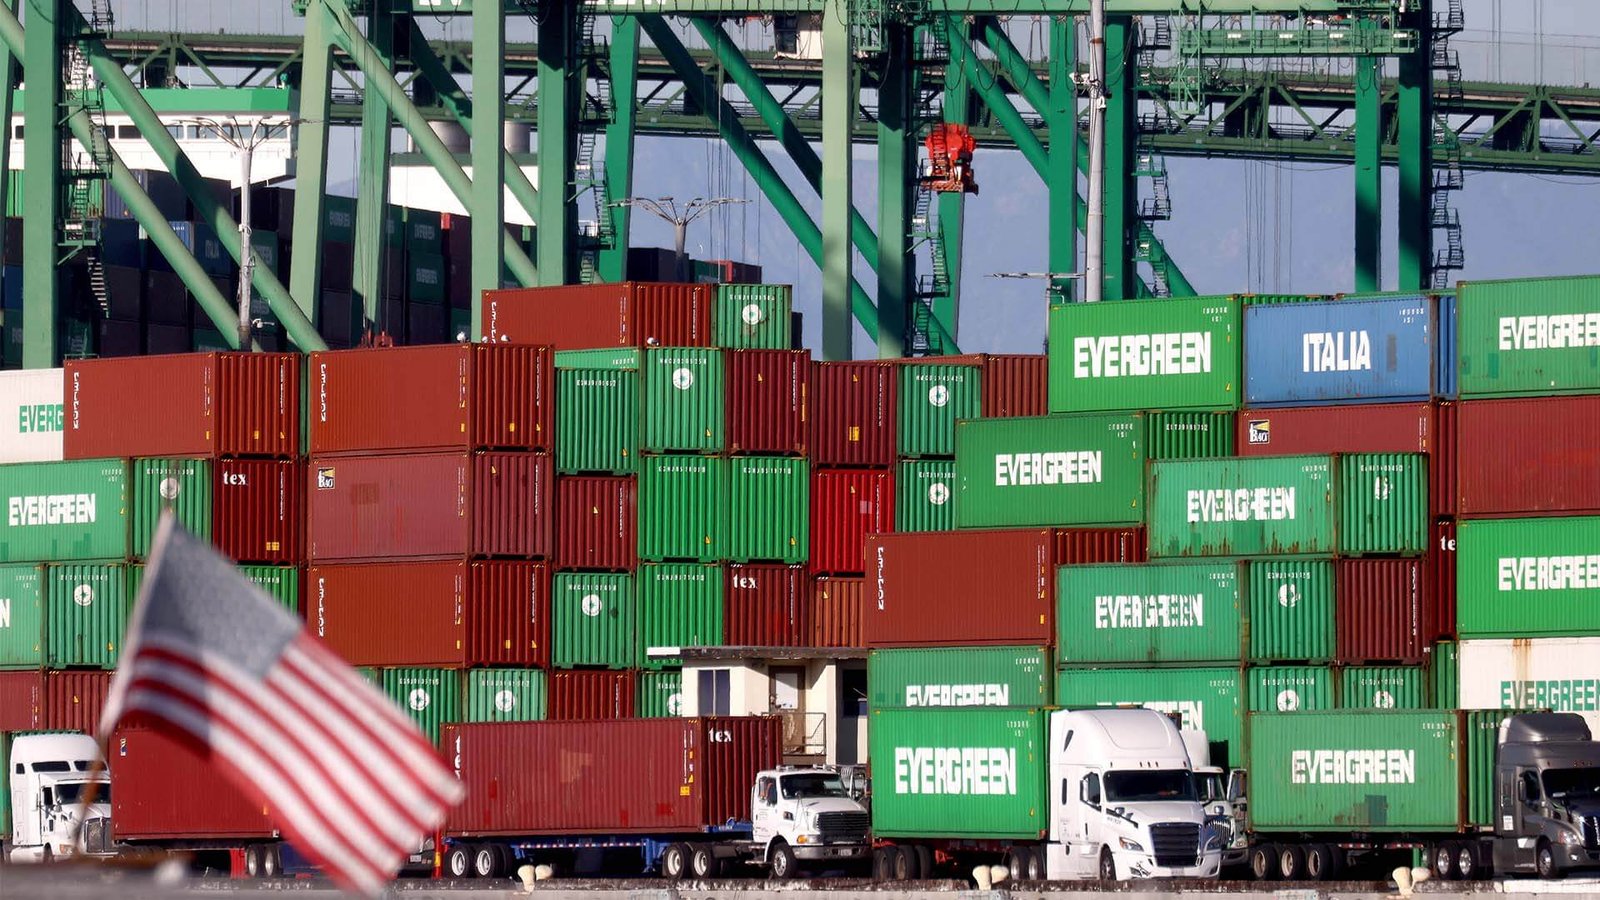
Port congestion at the LA/Long Beach terminals1 has become a routine challenge for U.S. importers. Delays can lead to rising costs, strained supply chains, and significant operational setbacks. Understanding this issue requires looking at measurable metrics and actionable strategies.
Port congestion at LA/Long Beach isn’t just “too many ships”—it shows up in measurable KPIs like vessel wait time2, container dwell time3, gate turn time4, and rail velocity5. These metrics predict delays and whether demurrage and detention risk is rising.
Port congestion can feel overwhelming. Yet, by understanding the underlying causes and metrics, importers can take steps to alleviate the impact on their operations. Let's explore how we can make sense of the congestion.
What “port congestion” means at LA/Long Beach?
Port congestion is not simply about the number of ships waiting to dock. It also includes critical KPIs that affect how swiftly your goods move through the port. These metrics are essential for understanding congestion's impact on your business.
Key metrics that define port congestion include vessel wait time2 (anchorage delays), container dwell time3 (days in the terminal), gate turn time4 (truck in/out speed), and rail velocity5 (how fast containers move to inland rail). When these metrics worsen, the risk for additional fees increases.
Congestion KPI Dashboard Table (Importer View)
| KPI | What it measures | What “bad” looks like | Importer impact | What to do |
|---|---|---|---|---|
| Vessel wait time | Time ships wait at anchorage | > 3 days | Increased shipping costs | Monitor vessel schedules |
| Terminal yard density | Space utilization in terminals | > 80% full | Delays in container movement | Track terminal capacity |
| Container dwell time | Days in the terminal | > 5 days | Demurrage fees | Optimize pickup processes |
| Gate turn time | Efficiency of truck movements | > 60 minutes | Increased drayage costs | Schedule pickups in off-peak hours |
| Appointment availability | Access to truck appointments | Limited slots | Delays in pickup | Book appointments as early as possible |
| Rail velocity | Speed of container movement to rail | < 25 containers per hour | Slower access to inland distribution | Coordinate with rail providers |
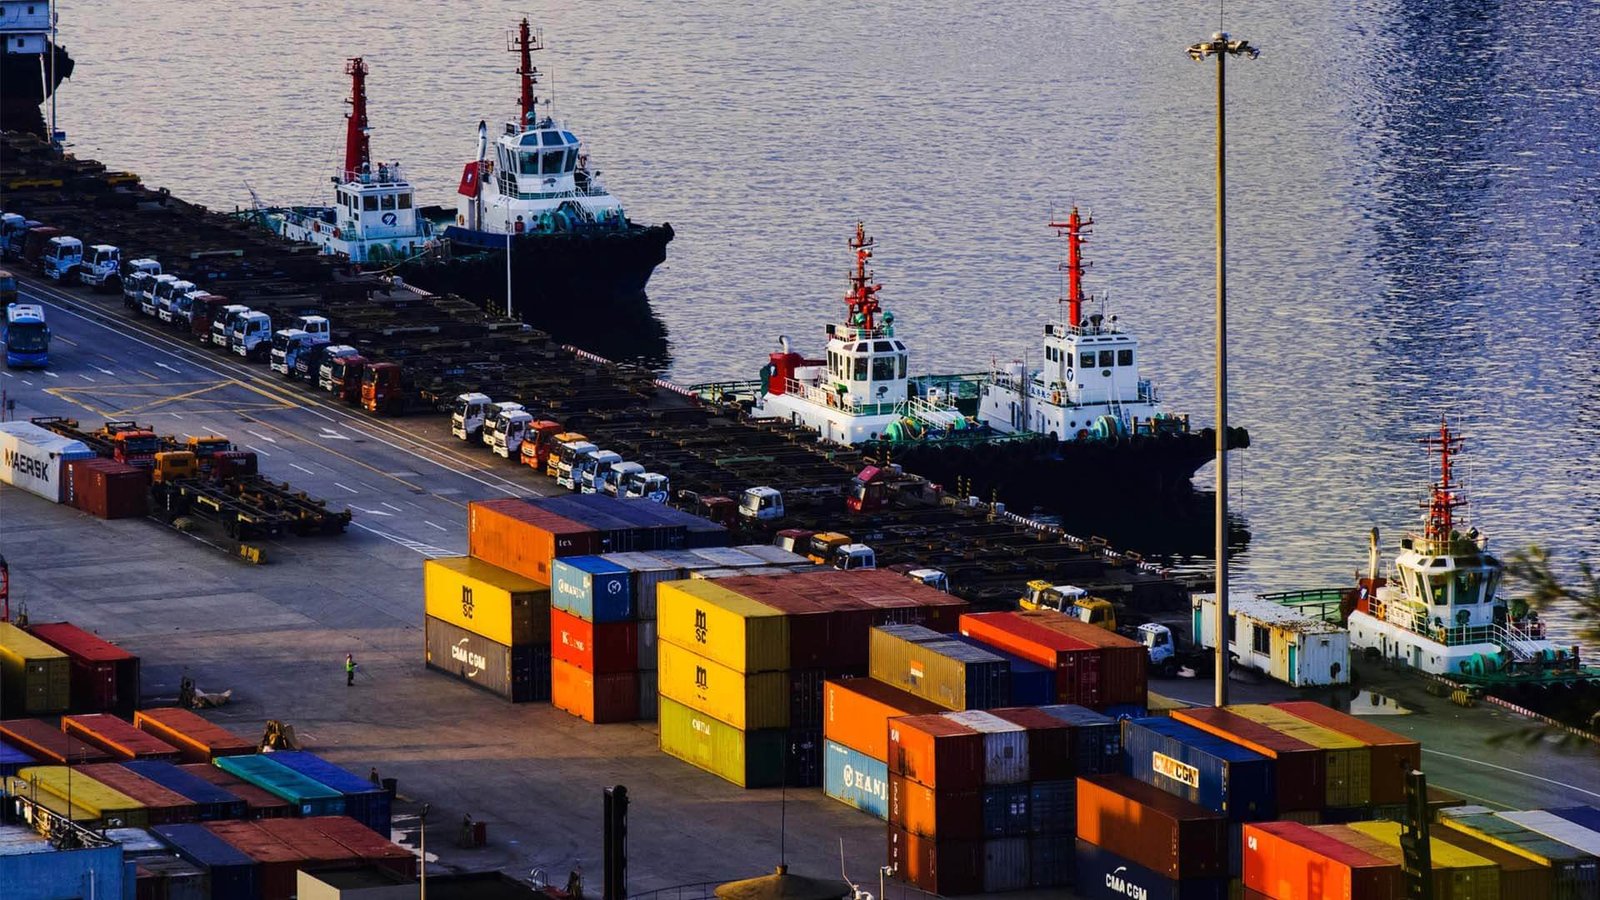
The real causes behind LA/LB congestion?
Understanding the root causes of port congestion is essential for effective management. The challenges at LA/Long Beach aren’t just about vessel traffic; they stem from various operational constraints.
Chassis shortages, terminal yard density6, gate restrictions, appointment availability7, and rail bottlenecks are the main culprits. Each of these factors can slow down container movement, leading to traffic jams and increased dwell times.
Chassis Shortage Impact Matrix
| Constraint | What happens operationally | What the importer sees | Direct cost impact | Mitigation tactic |
|---|---|---|---|---|
| Chassis shortage | Delays in container pickup | Limited availability for trucks | Increased drayage costs | Secure chassis early |
| Chassis split issues | Complicated pickup processes | Longer wait times | Additional handling fees | Optimize routing and planning |
| Empty return restrictions | Delays in returning empty containers | Increased detention fees8 | Higher operational costs | Schedule returns efficiently |
| Warehouse appointment mismatch | Missed pickup slots | Increased storage costs | Financial penalties | Coordinate appointments in advance |
| Terminal yard density spikes | Bottlenecks due to space limitations | Increased wait times and delays | Increased demurrage and detention fees8 | Monitor yard space and plan accordingly |
| Rail capacity constraints | Slower movement of containers to rail | Delayed access to inland transport | Increased supply chain costs | Evaluate alternative transport options |
How congestion translates into importer costs?
Now that we understand the causes, let’s look at how these issues translate into real costs for importers. Every hour lost or delay incurred can have a significant financial impact.
Congestion escalates costs through various fees, including demurrage when containers exceed their free time, detention when empty containers aren’t returned promptly, and additional drayage charges9 driven by scarcity. Late deliveries can also lead to indirect losses like stockouts and rescheduling costs.
Demurrage/Detention Cost Calculator (Importer Template)
| Cost item | Unit | Free time | Daily rate tier 1 | Tier 2 | Tier 3 | Total cost formula |
|---|---|---|---|---|---|---|
| Demurrage (terminal) | Per container | 5 days | $100 | $150 | $200 | (Days over free time) * Rate |
| Detention (carrier equipment) | Per container | 5 days | $75 | $125 | $175 | (Days over free time) * Rate |
| Chassis rental | Per day | 2 days | $50 | $75 | $100 | Days rented * Rate |
| Port storage / CFS storage | Per day | 3 days | $30 | $45 | $60 | Days over free time * Rate |
| Redelivery / reattempt | Per attempt | N/A | $100 | $150 | $200 | Fixed charge |
| Waiting time / dry-run | Per hour | N/A | $75 | $100 | $150 | Hours waited * Rate |
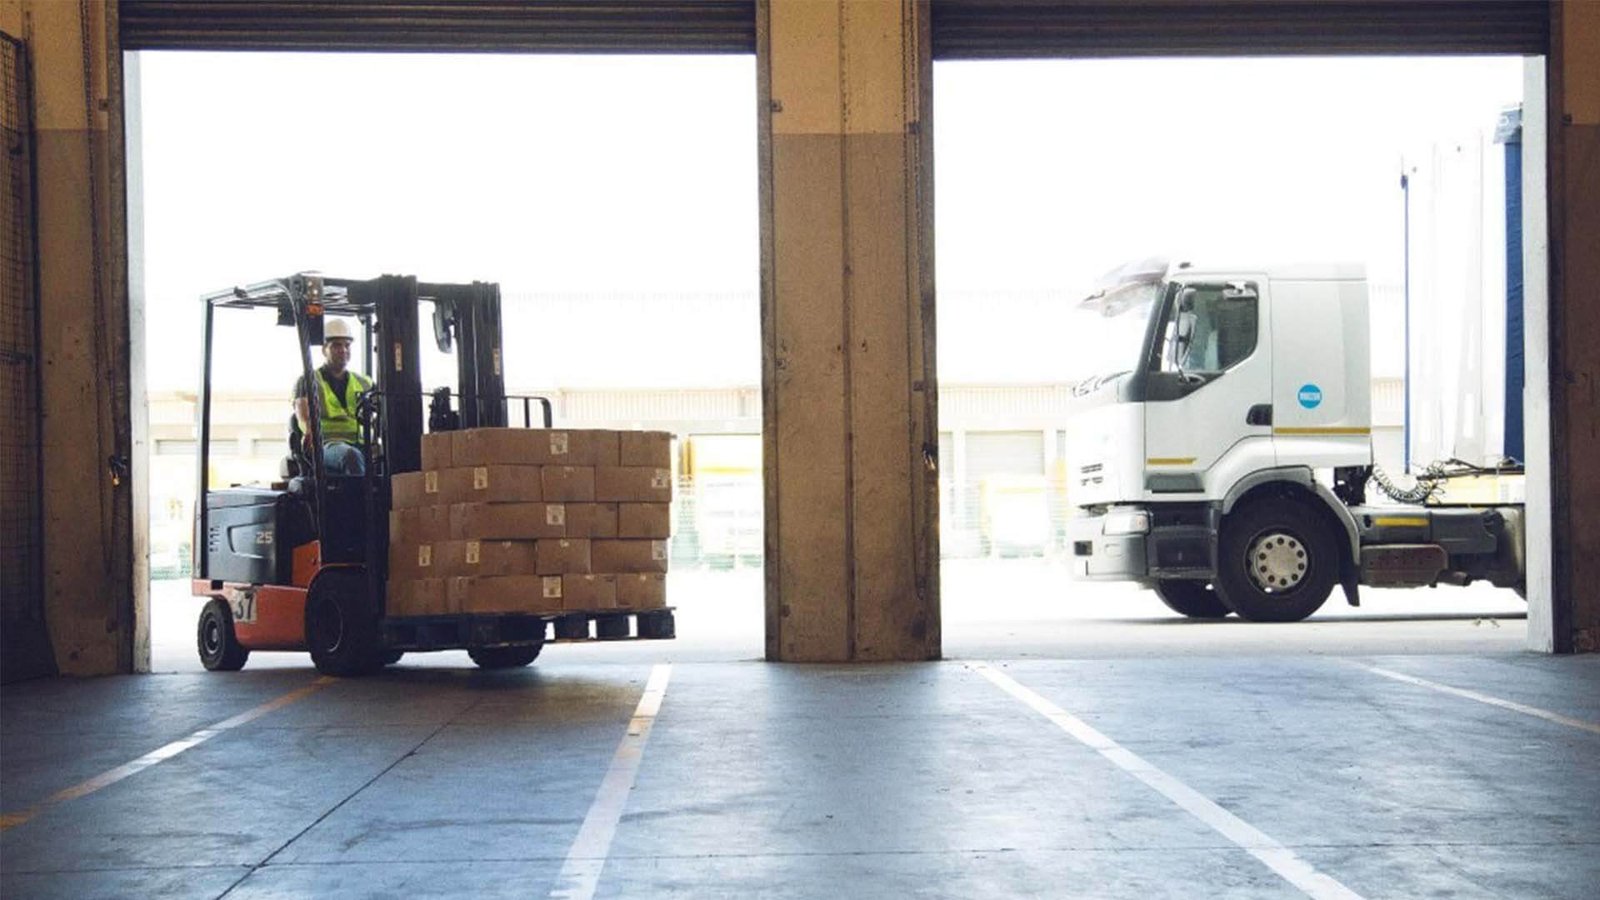
Where importers lose the most time in the process?
Tracking where delays occur in the process is crucial for mitigating risks. Often, the most significant time losses happen after the vessel discharge.
Delays can occur in various stages: after discharge, during cargo availability notices, at the pickup window, and during the out-gate process. Increased dwell time occurs when appointments aren’t secured, and documents aren’t ready, creating a chain reaction of costs.
Workflow Diagram: “Port → Drayage → Return”
- Vessel discharge
- Container staged in terminal yard
- Freight availability notice
- Customs release / holds cleared
- Appointment booking + chassis secured
- Pickup / out-gate
- Delivery appointment
- Unload
- Empty return (critical for detention control)
Importer playbook to reduce LA/LB congestion risk
Taking proactive steps can help importers reduce congestion-related risks. Understanding what to do before and during congestion is key to maintaining operational fluidity.
Importers can mitigate risks by pre-clearing customs10, monitoring free time, securing truck appointments and chassis early, and developing contingency routing plans11. Being proactive about these strategies can prevent costly firefighting later on.
Importer SOP to Reduce Congestion Cost
| Action | When to do it | Why it works | Owner | KPI to track |
|---|---|---|---|---|
| ISF/entry pre-clear readiness | Before shipment | Reduces hold times | Customs team | Clearance time |
| Document cutoffs with supplier | 1 week before arrival | Ensures timely documentation | Procurement | Document readiness |
| Daily milestone tracking | Daily | Keeps operations on schedule | Operations | KPI tracking |
| Appointment booking SOP | At least 5 days prior | Secures timely pickups | Logistics | Appointment success rate |
| Chassis strategy | Ongoing | Ensures truck availability | Logistics | Chassis availability |
| Warehouse appointment buffer | 1 week before arrival | Prevents scheduling conflicts | Logistics | Appointment success rate |
| Inland rail option evaluation | Before shipment | Provides alternate routing | Logistics | Cost comparison |
How a freight forwarder + customs broker mitigates congestion end-to-end?
Working with a freight forwarder and customs broker12 can significantly ease the congestion burden. They provide essential visibility and process control throughout the shipping journey, minimizing the risk of avoidable costs.
A forwarder and customs broker work as a control tower, emphasizing pre-clearance coordination, milestone visibility13, and exception management. This alignment prevents fees and ensures smoother operations.
Forwarder/Broker Control Tower Functions
| Function | What it prevents | Tools/process used | Value to importer | Evidence/KPI |
|---|---|---|---|---|
| Pre-clearance document audit | Delays at customs | Document management systems | Faster clearance | Clearance time |
| Holds management + escalation | Extended dwell times | Real-time visibility tools | Reduced fees | Number of holds managed |
| Drayage appointment planning | Missed pickup opportunities | Scheduling software | Improved pickup efficiency | Appointment success rate |
| Chassis coordination | Truck delays | Coordination with providers | Reduced wait times | Chassis availability |
| Free time monitoring | Demurrage exposure | Tracking systems | Cost control | Free time usage |
| D&D dispute support | Increased costs | Invoice auditing | Cost recovery | Number of disputes resolved |
| Contingency routing execution | Delays in delivery | Routing algorithms | Increased flexibility | Route effectiveness |
Contingency Routing Options (Decision Framework)
When congestion is high, making routing decisions becomes essential. Here’s a guide to when to stay at LA/LB or shift to alternate ports:
Routing Options vs Trade-Offs
| Option | Transit impact | Cost impact | Risk impact | Best for | Watch-outs |
|---|---|---|---|---|---|
| LA/LB direct dray | Quick access | Moderate | Congestion risk | Routine shipments | High congestion periods |
| LA/LB rail to inland | Longer transit | Potentially lower | Less flexible | Bulk shipments | Rail schedules |
| Alternate ports | Longer but less congested | Higher base costs | Increased risk of delays | Urgent shipments | Need to coordinate logistics |
| Transload to domestic | Moderate | Higher per unit | Flexible for distribution | Mixed cargo | Requires local warehousing |
| Split shipments / multi-port | More complex | Varies | Increased coordination needs | Diversified cargo | Complexity in planning |
Conclusion
Understanding port congestion at LA/Long Beach empowers importers to take actionable steps to reduce costs and manage operations effectively. By focusing on metrics and proactive strategies, we can keep cargo moving smoothly, even in challenging times.
Are you looking to keep your cargo moving through LA/LB even during congestion?
- Request a LA/LB congestion risk audit for your lanes.
- Ask for a demurrage/detention prevention SOP template.
- Get a routing options benchmark14 for peak season.
Understanding the root causes of congestion can help importers plan better and avoid costly delays. ↩
Knowing how vessel wait time impacts operations can help in planning and reducing shipping costs. ↩
Understanding container dwell time can help in minimizing demurrage fees and improving efficiency. ↩
Improving gate turn time can lead to reduced drayage costs and faster cargo movement. ↩
Optimizing rail velocity can enhance the speed of container movement to inland destinations. ↩
Monitoring terminal yard density helps in predicting delays and planning container movements. ↩
Securing appointments early can prevent delays and ensure timely pickups. ↩
Minimizing detention fees can lead to substantial savings in operational costs. ↩
Optimizing drayage charges can lower transportation costs and improve supply chain efficiency. ↩
Pre-clearing customs can reduce hold times and expedite cargo clearance. ↩
Developing contingency routing plans can provide flexibility and prevent costly delays during congestion. ↩
Working with these professionals can provide essential visibility and control, minimizing avoidable costs. ↩
Having milestone visibility ensures operations stay on schedule and reduces unexpected delays. ↩
A routing options benchmark can guide importers in choosing the best routes during high congestion periods. ↩